
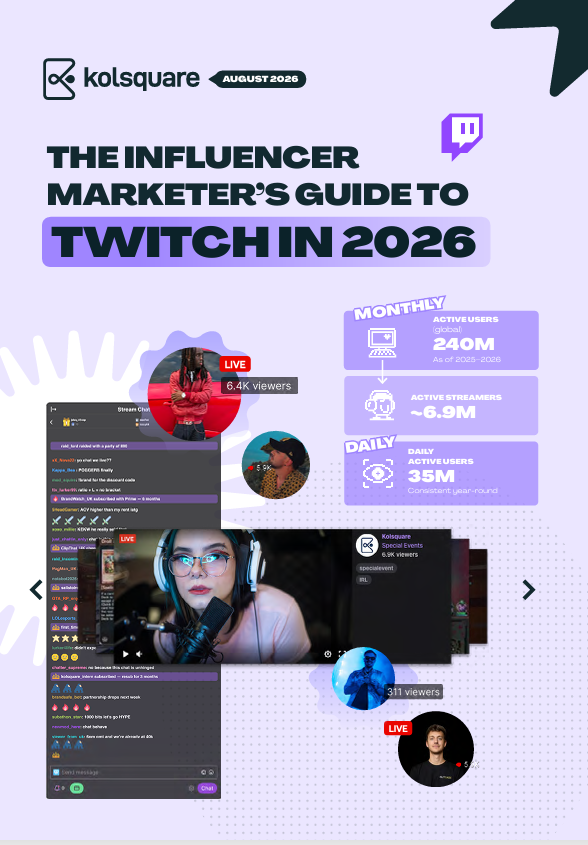
Twitch in 2026: The Influencer Marketing Guide
Twitch has outgrown its reputation as a platform for gamers. With 19 billion hours watched worldwide each year and 2.09 million people watching at any given moment, live streaming has become the television of the next generation. This Kolsquare guide compares seven European Twitch markets side by side — audience size, language share, creator concentration, prime time and seasonality — then sets out the collaboration formats, the selection method and the metrics that survive contact with a real campaign. Global and market-level data, updated for 2026.
Seven European Twitch markets, compared: what changes from one to the next, and what it costs to ignore it
Twitch by the numbers.
240 million monthly active users worldwide, 35 million a day, 2.09 million viewers watching concurrently at any given moment, and roughly 19 billion hours watched a year. Twitch is the largest dedicated live-streaming platform in the world, and the only one where the audience and the creator talk to each other in real time at scale.
Europe is not one Twitch market. It is seven.
Brands routinely plan Twitch as a single European channel and then discover that the same brief produces a completely different shortlist in Milan than it does in Paris. The table below is the shortest way to see why. Every column is drawn from the same June 2026 data set, so the markets can be read against one another rather than one at a time.
Concentration is the number that should change your shortlist.
Read the concentration column on its own and the picture is stark. In France, the top 10 channels take roughly 14% of national watch time. In Germany, 33%. In Italy, 42%. In the Dutch-language market, 74%. Swedish is 62%. The same brief produces a completely different risk profile in each.
What high concentration actually costs you.
In Italy or the Netherlands, a plan that ignores the top tier reaches almost nobody, and a plan that buys it pays event pricing for a single channel's calendar. Below that tier the audience falls away quickly, so mid-tier creators cannot be substituted in at volume. Concentrated markets are bought, not built: fewer partners, longer commitments, harder negotiation, and a real single-point-of-failure risk if that creator has a bad quarter.
What low concentration gives you.
France at 14% is the opposite proposition. The audience is spread across enough channels that a portfolio of mid-tier creators is genuinely viable, testing is cheap, and no single partner can hold the plan hostage. Spain at 16–18% behaves similarly at the planning level, even though its headline moments are the largest in Europe. Germany at 33% sits in between: a crowded, expensive top and a long tail almost nobody searches systematically.
Concentration tracks market size, inversely.
The smaller the language community, the more of it a handful of channels holds. That is why the Nordic and Dutch numbers look extreme rather than surprising: with roughly 2,400 concurrent Dutch-language viewers across about 246 channels, a market is thin by construction. It is also why "we ran this successfully in France" is weak evidence for Italy, and no evidence at all for the Netherlands.
Two figures in this table that do not mean what they look like.
Cross-market tables invite false precision, so two cells are deliberately marked rather than filled. The UK has no comparable concentration figure, because the only one available measures a global language pool. And France's published share of the global audience cannot be reconciled with its published user count; the guide will carry the user count and a corrected share. Both are set out in the notes above. A comparison is only worth building if it says where it stops.
Who watches Twitch, really.
The cliché of the 20-year-old with a controller no longer holds. 35% of the global audience is female, the average user is 26, and 28% of viewers are over 35. Non-gaming categories — Just Chatting, IRL, music, talk shows — now account for 32 to 39% of total watch time, against roughly 20% in 2020. Just Chatting alone is 13.8% of the entire platform. Twitch does not publish country-level demographics, so the guide works with platform-wide figures and says so wherever it does.
Why live changes the equation for brands.
A stream runs for two to eight hours. That is time enough to demonstrate a product, answer questions in the chat and give a reasoned opinion. A 2025 Amazon Ads study found that 54% of viewers trust their favourite streamers to recommend products, rising to 67% among the most engaged. That is what makes Twitch the strongest consideration lever in influencer marketing today, in every market in the table.
Reach or consideration: resetting expectations.
Twitch does not deliver Instagram or TikTok volumes, and the guide explains why that is the wrong test to apply. It also covers the role of viewer-created clips, which carry a stream's reach onto TikTok, Instagram Reels and YouTube Shorts long after the broadcast ends.
Language is not a country, and in four of these markets that breaks the plan.
Twitch organises audiences by language, not by nationality, and planners who forget it buy the wrong thing. English is a global category dominated by US creators, so UK planning has to be done at creator level. Spanish spans Spain and the whole of Latin America: the fifth-largest channel in the Spanish top 10 is Mexican. French carries Belgium, Wallonia and Québec alongside France. Dutch covers the Netherlands and Flemish Belgium as one pool and cannot be split. And the Nordics have no shared Twitch language at all: their most prominent creators — forsen, MrSavage — broadcast in English and compete globally, so Nordic reach is usually bought through English-language creators with demonstrated Nordic audiences rather than through the small native-language channels.
Prime time is almost the same everywhere. The calendar is not.
Every market in the table peaks in the evening, in a window that runs from around 6pm to 10 or 11pm local time, with Spain the clear outlier at 8pm to midnight and Italy shifted an hour later than France or Germany. Weekends lead everywhere; the strongest weekday differs by market. Seasonality is where the divergence is real: France concentrates on ZEvent in September, Germany on the Eligella Summer Games in June and Gamescom in August, Spain on La Velada del Año in July and the Kings League from January to June, Italy on Kings League Italy across the same first half, the UK on autumn esports. The Nordics and Benelux have no annual anchor at all. A single European flight date will land on a peak in one market and dead air in another.
How to select a streamer.
Follower count says almost nothing about how a stream performs. Two figures matter: average concurrent viewers (ACV) and peak viewers, and they are only meaningful read together. The guide explains how to interpret the gap between them, and why creators in the 500 to 5,000 average concurrent viewer range often deliver the strongest brand integrations. In concentrated markets that band sits well below the top 10; in France or Spain it is where most of the addressable audience actually lives.
The collaboration formats available.
Sponsorship integration, branded live production, chat commands and interactive overlays, co-streaming, gifting, the Twitch ad network, clips. Seven formats, with very different production costs and objectives that do not overlap. For each one the guide sets out the brief, the level of control and the objective it answers.
The metrics to track after the stream.
Peak concurrent viewers is the most visible Twitch metric and the least useful for measuring a campaign. The guide sets out the indicator set that genuinely reflects performance: average concurrent viewers, viewer-hours, unique chatters, clip volume and clip reach. It also flags a data limit to plan for at brief stage, since Twitch keeps VODs for 60 days on partner channels and 14 days for everyone else, and archiving is not automatic. Run a multi-market campaign without a capture workflow and the first market's numbers are gone before the last one launches.
A worked European example, outside gaming.
The Paris Chamber of Trades and Crafts wanted to change how 15 and 16 year olds see manual careers. Nine monthly live streams, one creator, apprentices filmed in the workshop, no gaming connection at all: 2.5 million views, 29,000 interactions and 150,000 unique people reached. A French public body with no games in the brief is a useful test case precisely because nothing about it is transferable by category — what transfers is the mechanism. The full campaign, its three headline results and the marketing team's own read on it are in the guide.
Twitch is now on Kolsquare.
Twitch profiles are searchable in the platform with stream-level filters: average concurrent viewers, peak viewers, watch time and game category. Six months of content history make it possible to assess a creator's consistency, spot event-driven spikes and vet a profile properly before any budget is committed — in any of the markets above, on the same criteria.
Who it is for.
Brands and agencies weighing up Twitch before investing, international teams that have to allocate one live budget across several European markets, teams already activating creators locally and looking to structure their measurement, and influence leads defending a first live budget internally.
Why download it now.
2026 is the year Twitch stops being an experimental channel in Europe. Mega-creators are migrating across from TikTok and Snapchat, non-gaming categories now take between a third and two fifths of watch time, and the gap between the most and least concentrated European market is more than fivefold. Running one Twitch strategy across Europe is the single most expensive assumption in the category. This Kolsquare guide brings together the data, the formats and the method to arrive on the platform with a strategy rather than a test.

FAQ
The Dutch-language market, where the top 10 channels take around 74% of all viewing time, followed by Swedish at ~62%, Finnish at ~49%, Norwegian at ~44%, Danish at ~38% and Italy at ~42%. Among the large markets Italy is by far the most concentrated: its top 10 Italian-language channels hold ~42% of watch time, three times France's ~14%. Germany sits at ~33% and Spain at ~16–18%. Concentration rises as market size falls, and it is the single biggest reason a creator shortlist that works in France does not transfer to Italy or the Netherlands (SullyGnome and TwitchTracker, June 2026).
No, and the concentration data is the clearest proof. In France, with ~14% of watch time in the top 10, a portfolio of mid-tier creators is viable and testing is cheap. In Italy at ~42% or the Dutch-language market at ~74%, the top tier is effectively unavoidable and mid-tier substitution does not work. Seasonality diverges just as sharply: ZEvent in September for France, the Eligella Summer Games in June and Gamescom in August for Germany, La Velada del Año in July and the Kings League from January to June for Spain, Kings League Italy for Italy, autumn esports for the UK, and no annual anchor at all in the Nordics or Benelux. Prime time is the one thing that does travel, at roughly 6–10pm local, with Spain later at 8pm to midnight (TwitchTracker and SullyGnome, June 2026).
Germany 22.2 million monthly active users (8.69% of the global audience, #3 worldwide), the United Kingdom 13.4 million (5.23%, #5), France 11.3 million, Spain 10.5 million (4.10%, #6) and Italy 8.3 million (3.24%, #9). Sweden, the largest Nordic market, is around 4.5 million (~1.8%), and the Netherlands is estimated at 1.5 to 2 million with no published figure. Shares are calculated on the ~256 million base implied by the published market figures; the platform's headline global figure is 240 million monthly active users (Icon-era and worldpopulationreview.com, 2026).
No, and treating it as such is the most common error in UK Twitch planning. English is a single global Twitch category worth roughly 49% of all watch time, around 162.8 million hours a week, and it is dominated by US creators, so there is no meaningful "English equals UK" filter. The figure sometimes quoted as "the UK top 10 takes 9% of watch time" is in fact the top 10 English-language channels' share of global English viewing, which is why it cannot be compared with Italy's 42% or Germany's 33%. Credible UK analysis ranks UK-nationality streamers by hours watched instead (StreamsCharts, March 2026).
No. Globally, 35% of Twitch users are women, the average age is 26 and 28% of viewers are over 35. Non-gaming categories — Just Chatting, IRL, music and talk shows — account for 32 to 39% of total watch time, up from around 20% in 2020, and Just Chatting alone is 13.8% of the entire platform. Twitch does not publish country-level demographics, so market-level planning has to use platform-wide figures as proxies (TwitchTracker and SullyGnome, June 2026; SimilarWeb, April 2026).
Read average concurrent viewers (ACV) and peak viewers together: a narrow gap signals a stable, loyal community, while a wide one usually means a giveaway, a raid or a viral clip inflated a single moment. Creators averaging 500 to 5,000 concurrent viewers tend to deliver the most authentic integrations, though in concentrated markets that band sits well below the visible top 10. Seven collaboration formats are available — sponsorship integration, branded live production, chat commands and interactive overlays, co-streaming, gifting, the Twitch ad network and clips. Measure with ACV and viewer-hours rather than peak, with chat activity and clip reach completing the picture, and capture the data during the campaign: Twitch keeps VODs for 60 days on partner channels and 14 days for everyone else (Twitch Help, 2026).
Don't miss a thing!
Every month we gather the top data, trends, and analysis on the creator economy. Only what matters. Straight to your inbox
L’essentiel, directement dans votre boîte mail.
.webp)